- Error Type: If the PTC appears as an absolute difference, input ‘const’; if it displays as a percent change, input ‘prop’.
- Y Variable Column: Enter the evaluated variable name (case sensitive) shown in the uploaded file.
- X Variable Column: Enter the targeted variable name (case sensitive).
- Vertical Axis Label: Specify what should appear on the plot’s vertical axis and include the unit of measurement if needed.
- Horizontal Axis Label: Specify what should appear on the horizontal axis.
- Minimum Value for Axes: Provide the minimum value of your data range. It is best to use the lowest analytical range.
- Maximum Value for Axes: Provide the maximum value of your data range. It is best to use the highest analytical range.
- By (log base for PROP or increment for CONST): Enter linear increment with Const error type. For example, if the data range is from 0-100, enter 10 is a reasonable choice. Enter exponential increment with Prop error type. For example, if the data range is from 1-600, enter 2 is a reasonable choice. Here, the axis will display as ‘1, 2, 4, 8, 16, 32, 64, 128, 256, 512’.
- CP Allowance (default 0.95): Enter the PTC allowance for coverage probability.
- TDI Allowance: Enter the PTC allowance for total deviation, measurement unit or percent change for Const or Prop error type, respectively.
- Decimal Places for TDI (default 2): Enter the decimal place for printing TDI.
- Alpha (default 0.05): Enter the confidence level,100(1-alpha)%, for computing the one-sided confidence limits.
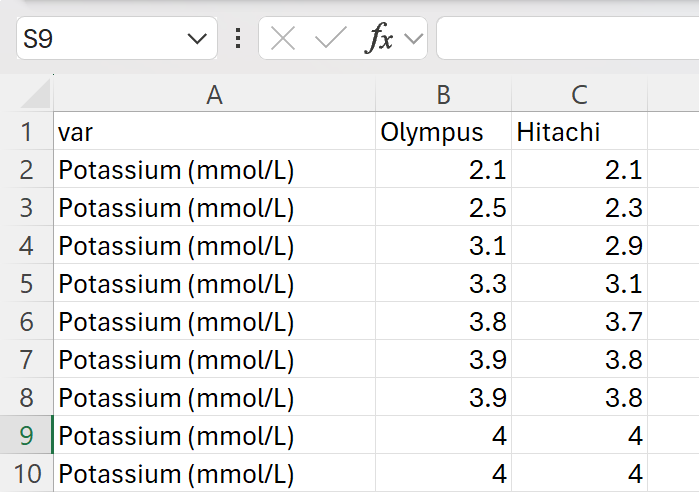
Suppose we have a csv file like shown below and assuming constant error type. Then Error Type=const, Y Variable Column=Olympus, X Variable Column=Hitachi, Vertical Axis Label=Olympus AU400e, Horizontal Axis Label=Hitachi 911, Minimum Value for Axes=1, Maximum Value for Axes=10, by=1, TDI Allowance=1.